Data Ingestion: Modbus Connections
Go to Modbus > Modbus Master to view all the Modbus TCP and RTU/ASCII devices. In addition to setting up Modbus TCP and Modbus RTU devices, you can also enable/disable Device Fail Event and Command Fail Event of the Modbus Master services here.
To add a Modbus TCP device, do the following:
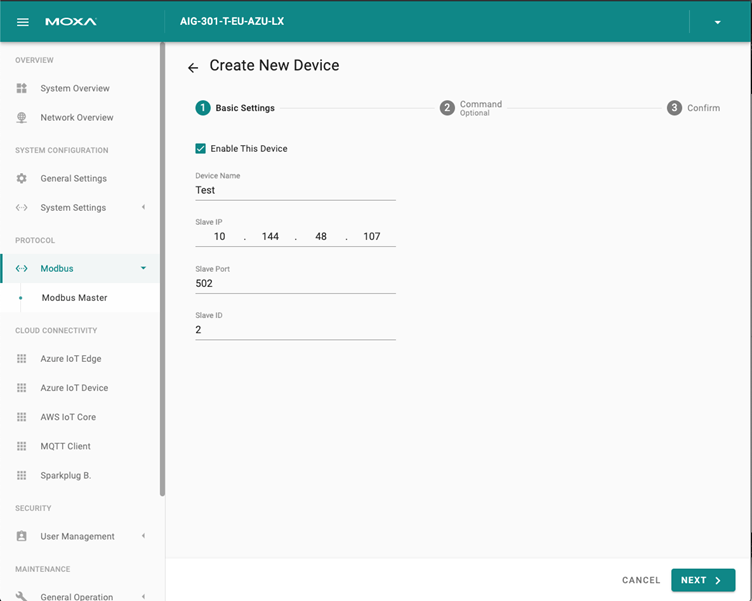
In the Modbus TCP section, select the TCP option.
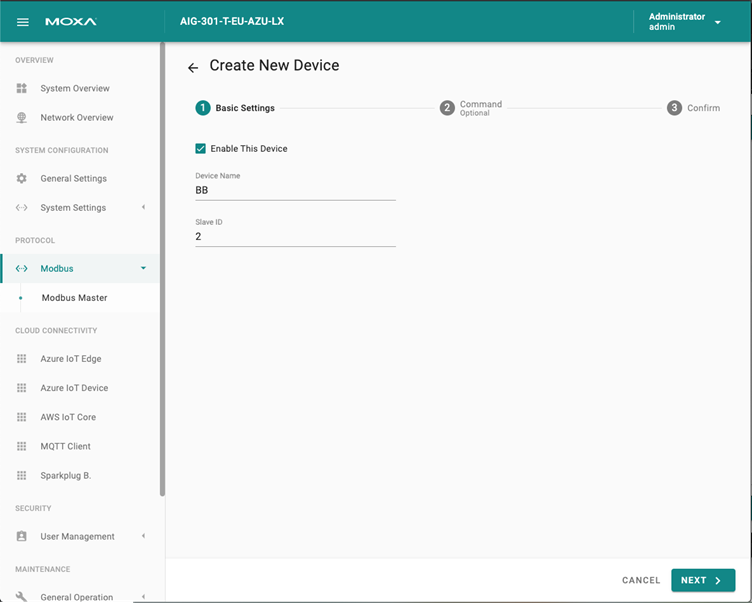
Click ADD DEVICE. a. Specify the Device Name. b. Enter the Slave IP address. c. Specify the Slave Port and Slave ID. d. Click NEXT.
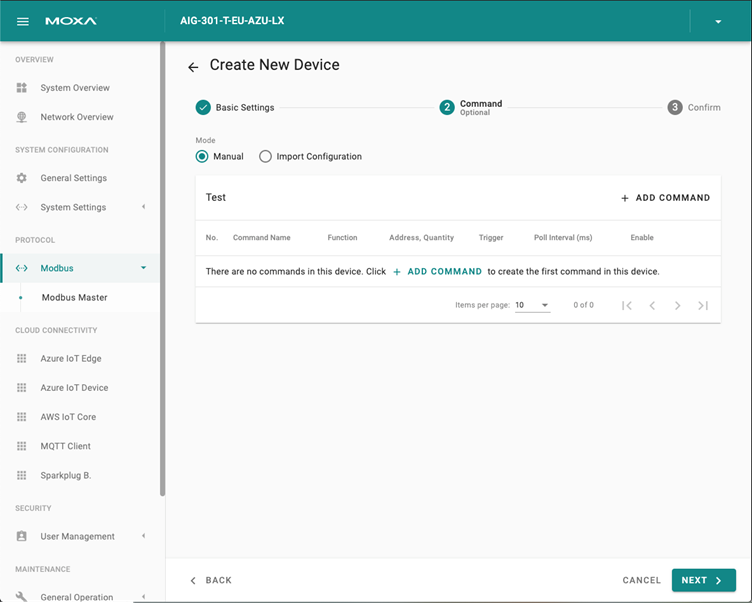
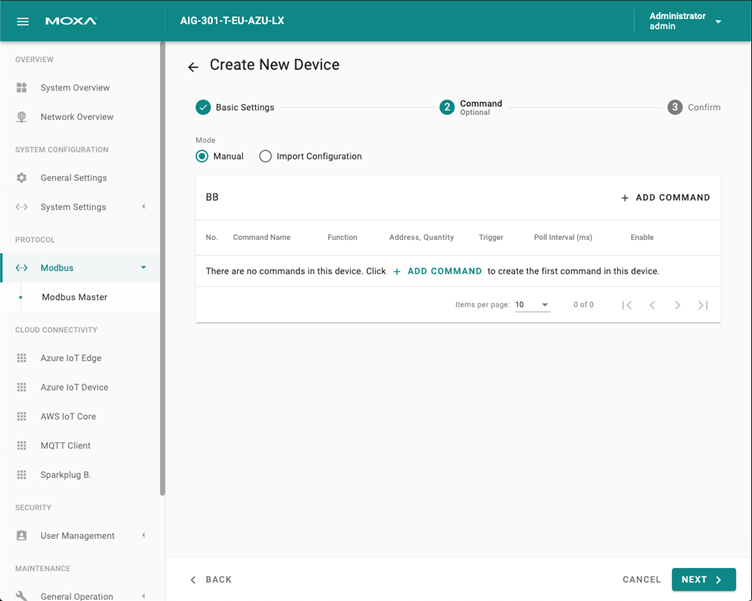
Click + ADD COMMAND.
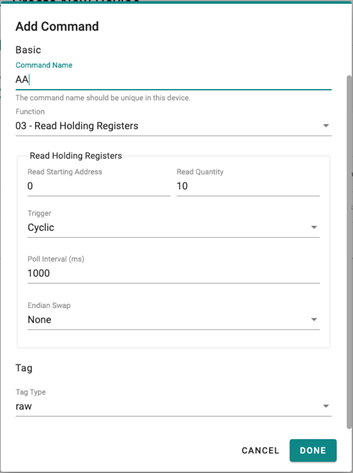
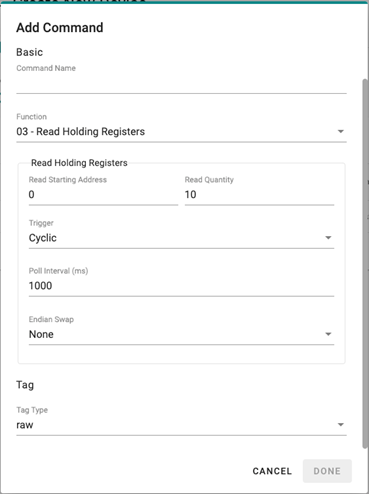
Select or specify the function and the corresponding settings.
Select the Tag Type.
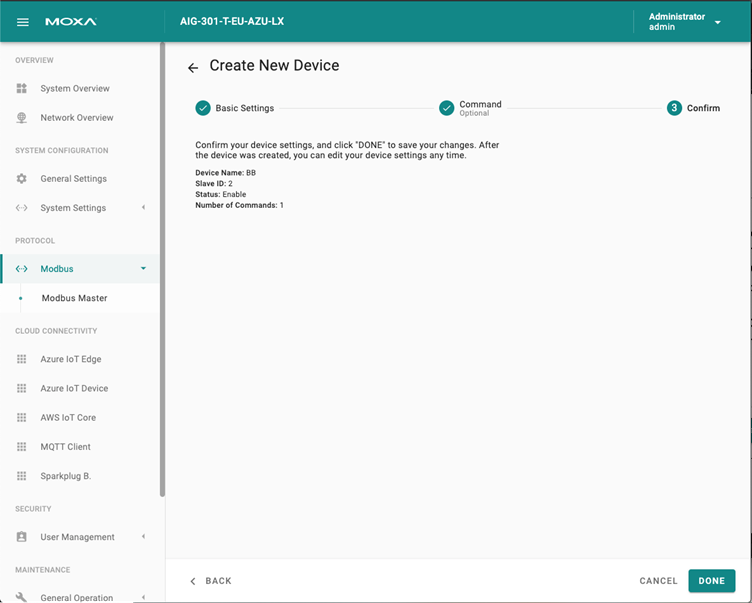
Click DONE.
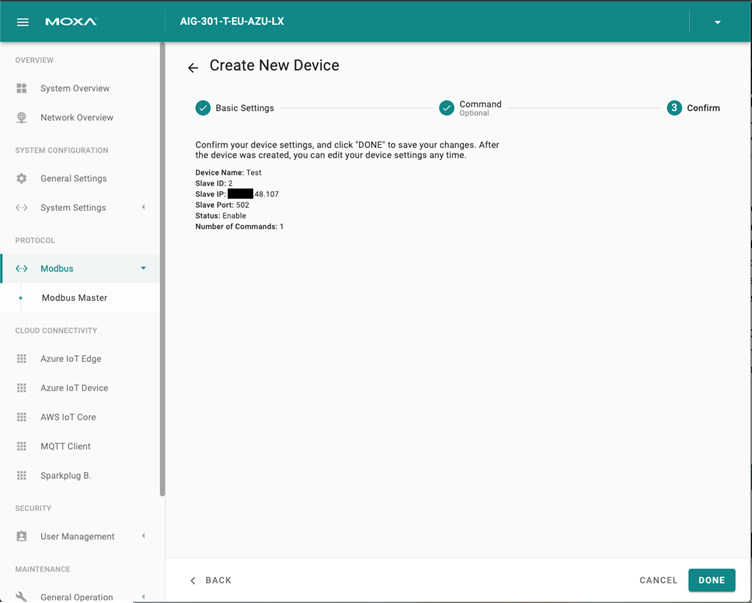
Click NEXT.
Click DONE to save the settings.
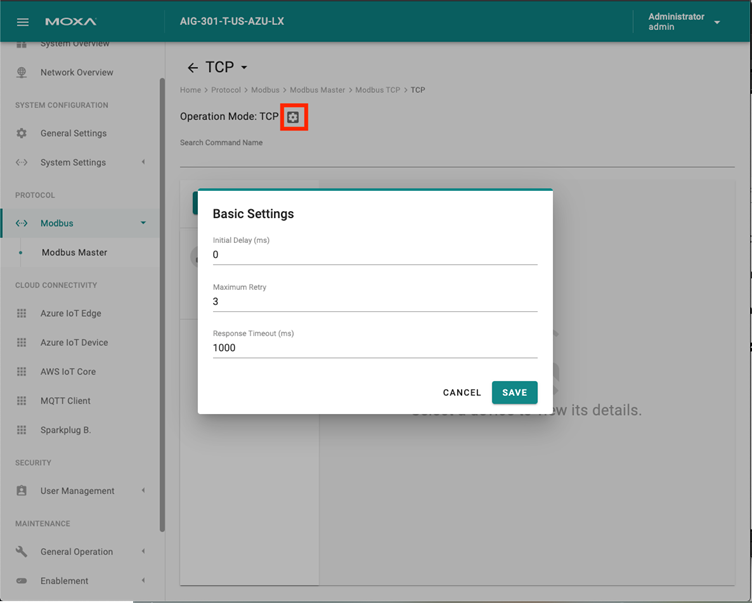
To configure a Modbus TCP interface, select the TCP option and then click ![]() You can also specify Initial Delay, Maximum Retry, and Response Timeout (ms) values for the interface.
You can also specify Initial Delay, Maximum Retry, and Response Timeout (ms) values for the interface.
To add a Modbus RTU device, do the following:
In the Modbus RTU/ASCII section, click on the COM (RTU) button.
Click ADD DEVICE. a. Specify the Device Name and Slave ID. b. Click NEXT.
Click + ADD COMMAND.
Select or specify the function and the corresponding settings.
Click NEXT.
Click DONE to save the settings.
To configure Modbus RTU settings, select the RTU option and click ![]() . You can also specify Initial Delay (ms), Maximum Retry, and Response Timeout (ms) values for the interface. To manually set the inter-frame delay and inter-character timeout, you can uncheck the items and specify a time (ms).
. You can also specify Initial Delay (ms), Maximum Retry, and Response Timeout (ms) values for the interface. To manually set the inter-frame delay and inter-character timeout, you can uncheck the items and specify a time (ms).
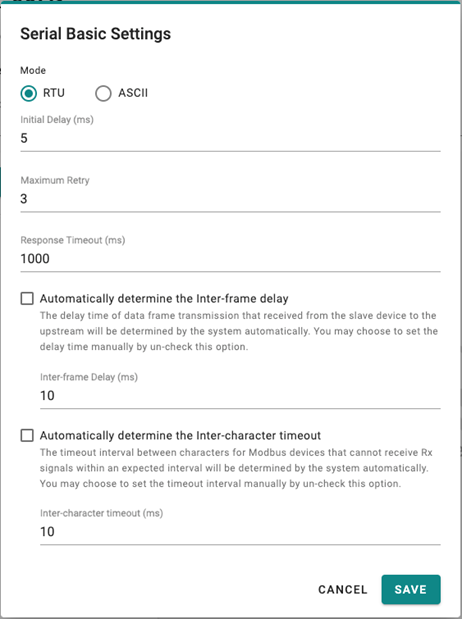
Note: The inter-frame delay and inter-character timeout settings are only available for Modbus RTU.
Modbus Log Level Setting
To set a level for Modbus logs, following the below commandline to set it.
$modbuscli log-level {command}
{command}:
show: get modbus current log level
set {level}: set modbus log level
The log level includs:
| Level | Severity | Description |
|---|---|---|
| [0] | ALL | includes all level information |
| [1] | TRACE | finer-grained informational events than the DEBUG, typically capturing the flow through the application |
| [2] | DEBUG | fin-grained informational events for debug |
| [3] | INFO | informational events for the progress of the application |
| [4] | WARN | potentially harmful situation (Default Level) |
| [5] | ERROR | errors in the application, possibly recoverable |
| [6] | FATAL | fatal errors to stop the application running |
| [7] | OFF | not display anymore |
Note that changing the log severity requests restart Modbus Master.
Modbus Status Check
To check the Modbus status, following the commands below.
$modbuscli status {connection}
{connection}:
serial: display the status of the Modbus master serial
tcp: display the status of the Modbus master tcp
Modbus Traffic Log
To see the Modbus traffic log, following the command below. You can specify a period of time for traffic monitoring.
$modbuscli traffic {time_seconds}
Last updated on 2022-10-13 by jamescw.kao