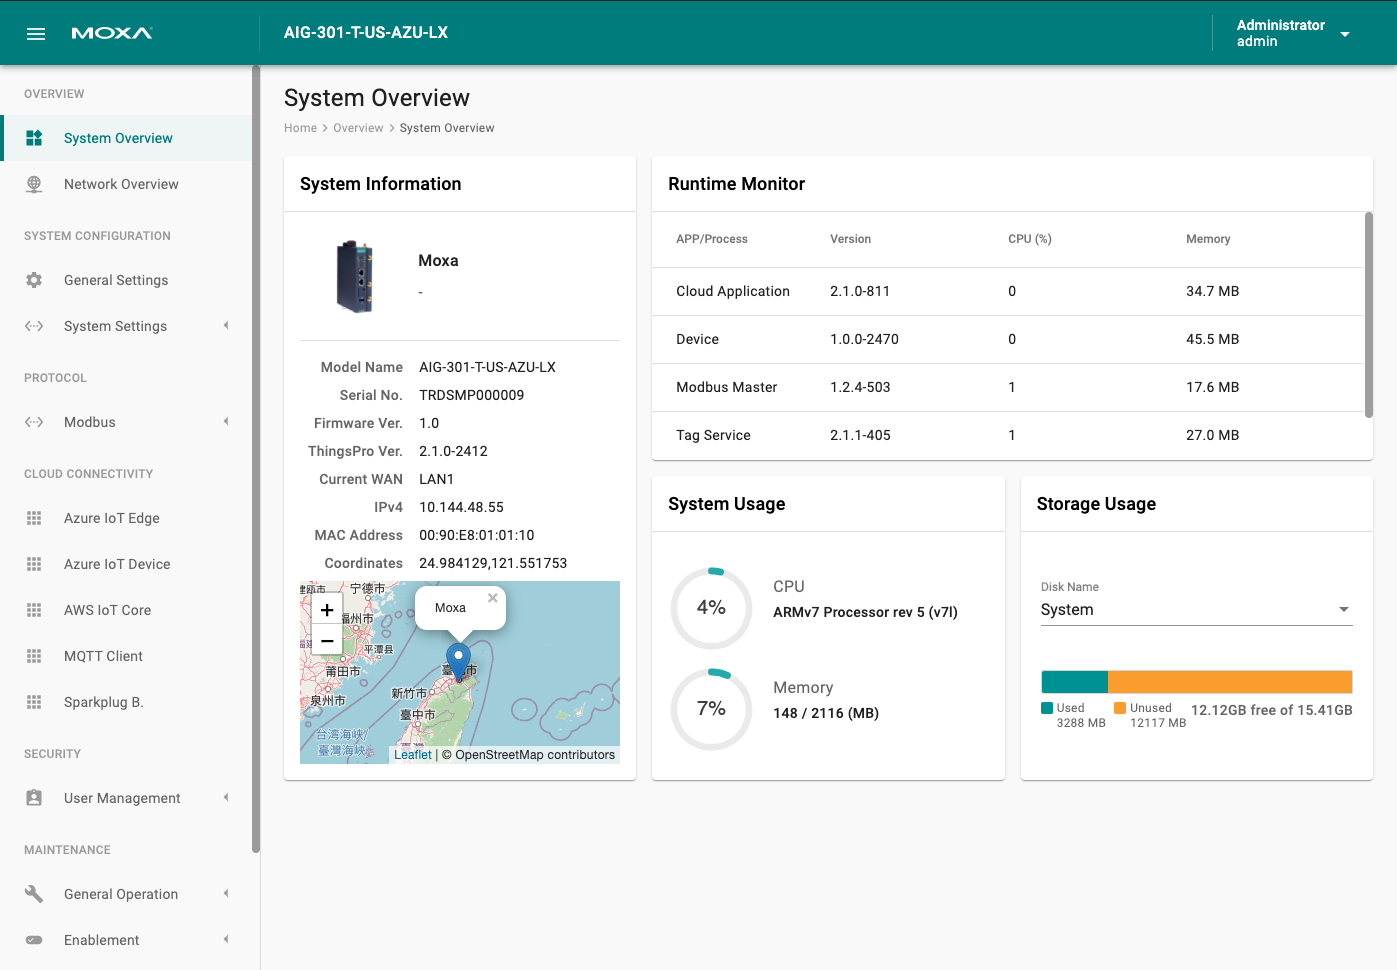
Dashboard
System Overview
The dashboard shows the system status of the device, including hardware information, running applications/processes, CPU/memory, and storage usage.
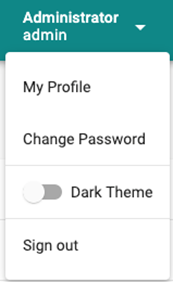
Editing User Profiles
Click on the Administrator button on the upper-right corner of the page to view your profile, change the password, and switch to the Dark Theme.
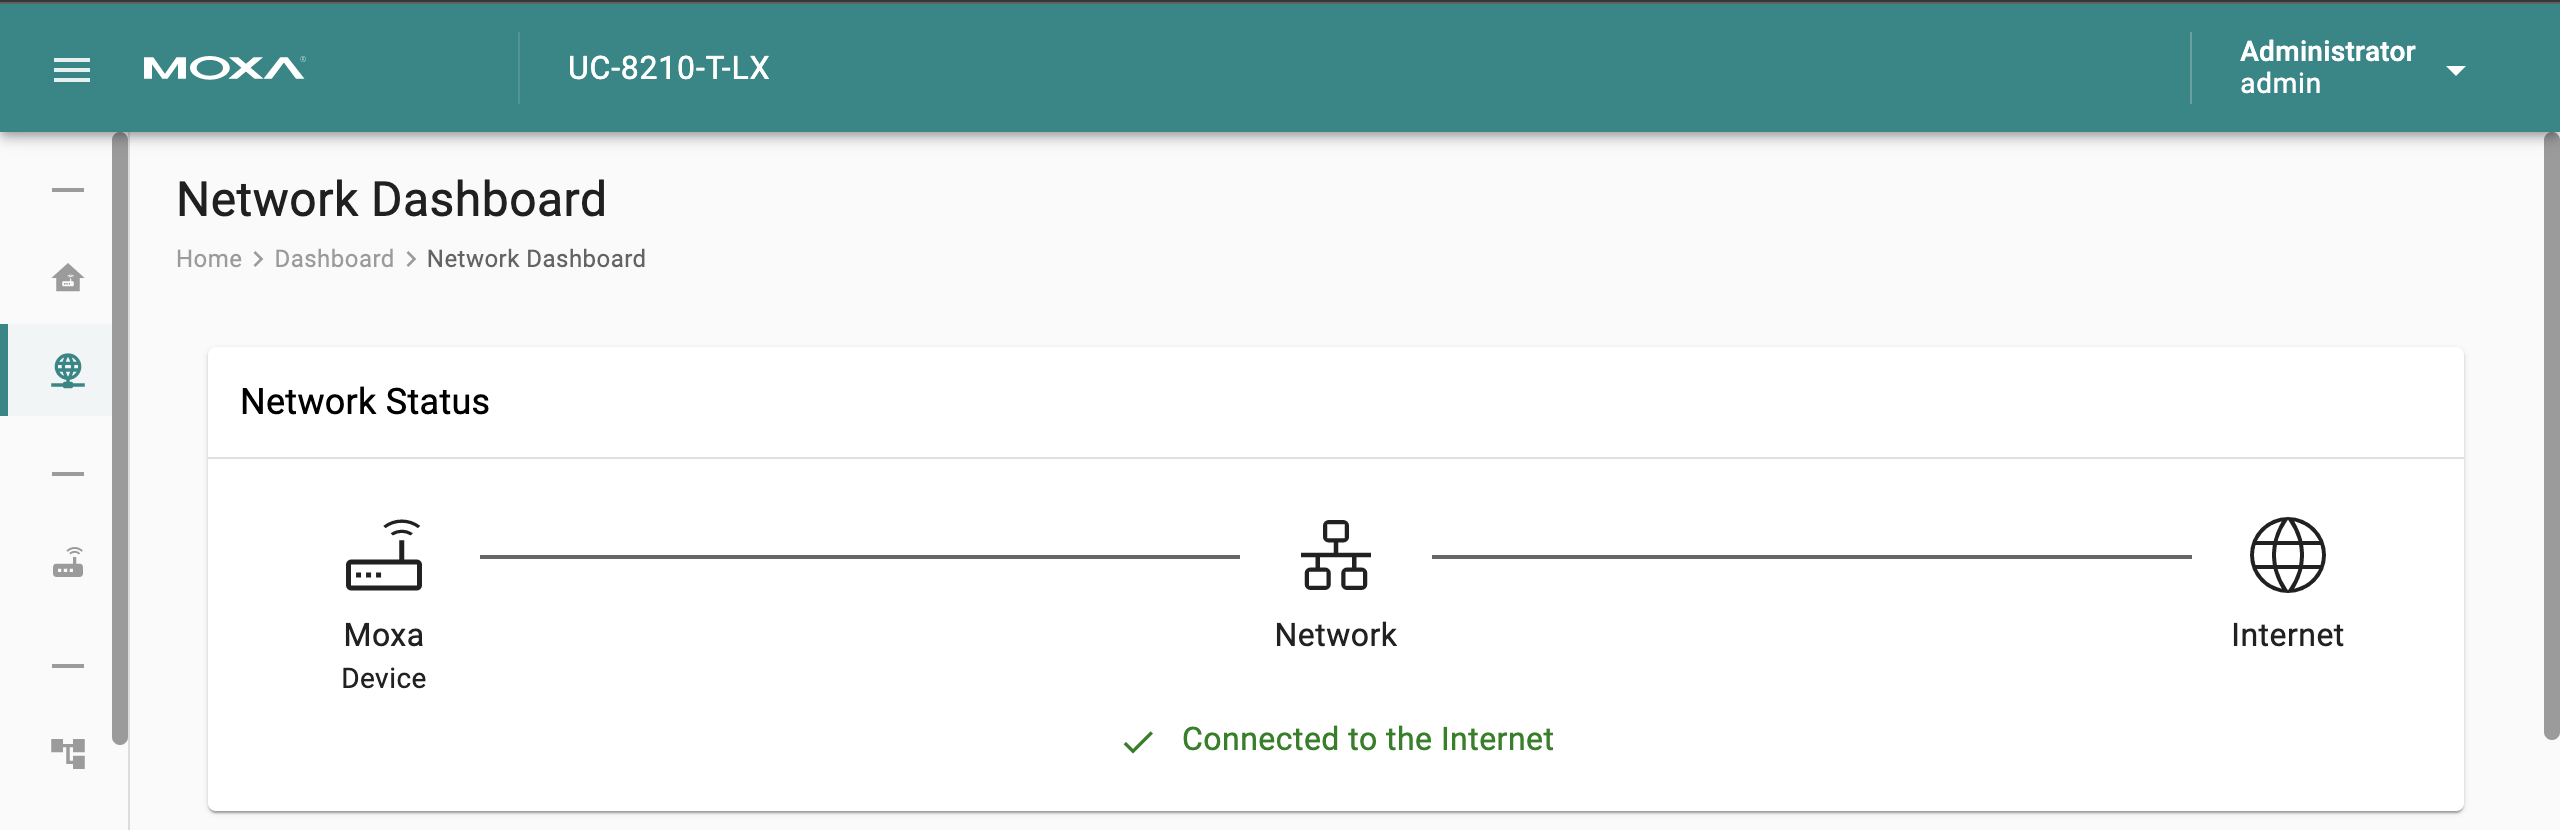
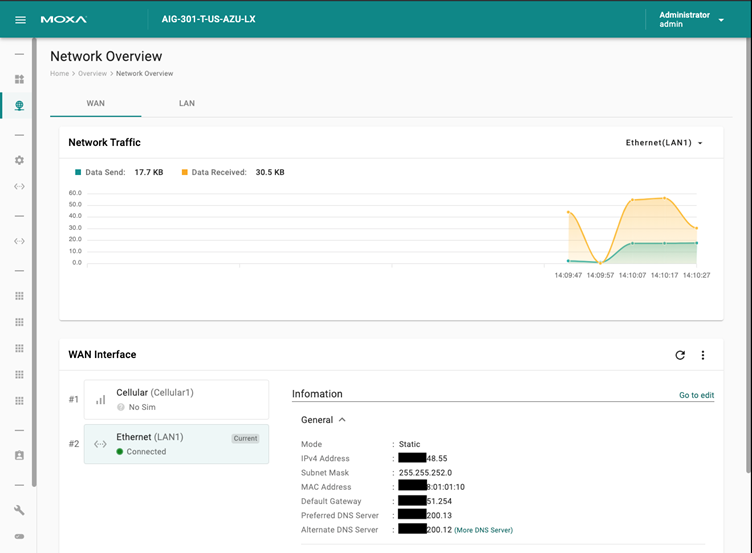
Network Dashboard
Displays information on the WAN and LAN interfaces and the network traffic passing through them.
Network Status
Displays the current status of the Internet connection. The system will check the status of the default gateway (or associated network adapter) and then the Internet connection when entering the Network Dashboard page.
The network inspection is based on the response from the domain http://google.com when an HTTP request is sent.
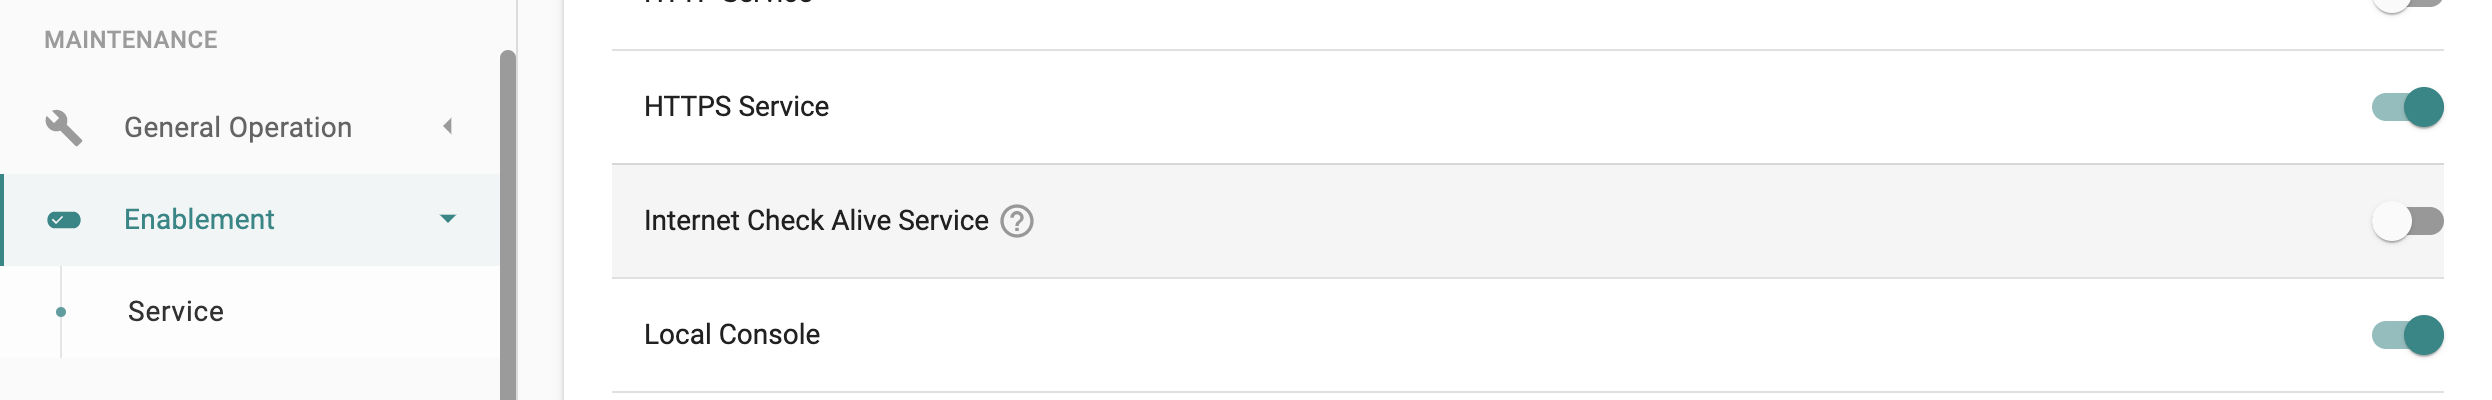
To monitor the Internet connection status, you can enable the Internet Check Alive Service under MAINTENANCE > Enablement > Service > System and receive the correspondent events when Internet is disconnected or reconnected. The default check interval is 60 seconds.
WAN
Displays information on the data sent and received through the WAN interfaces. You can select the interface that you want to monitor. In addition, other details on the usage of the WAN interfaces is displayed on the page. The information on the page is refreshed every 10 seconds.
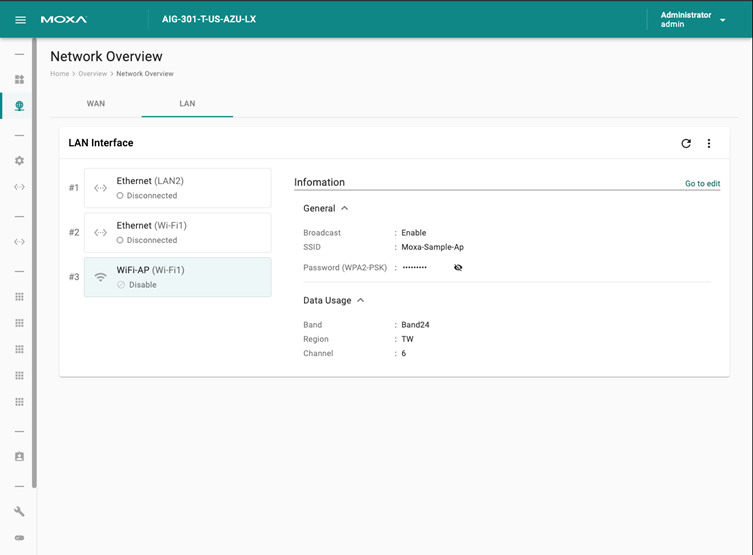
LAN
Information on the LAN interfaces is organized under the LAN tab and includes information on the usage of the interfaces and the traffic passing through them.
To monitor the interfaces in real time, click “![]() ” to auto refresh the data every 10 seconds.
” to auto refresh the data every 10 seconds.

Last updated on 2022-07-22 by Cecilia Fernandes